Al Salam 3alikom w ra7mat Allah w barakatoh :)


It's an assignment we took in visualization. The color map editor.
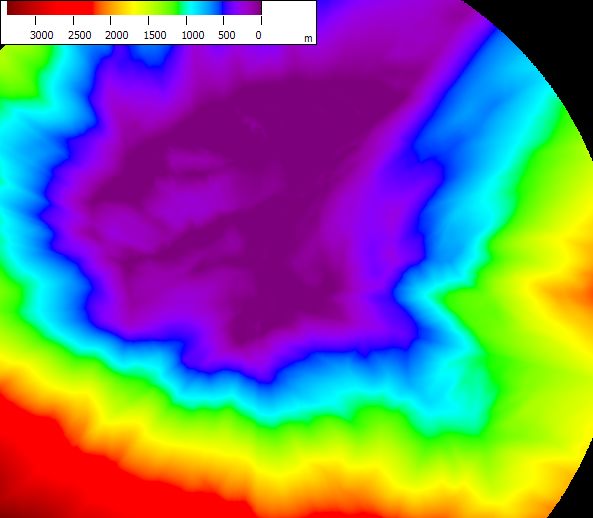
Does this picture look familiar?

I guess most of us has seen similar pics in our geography study @ school
How was this picture drawn??
As u can see, the brown parts represent high areas (like mountains), green parts are just ground & blue will be the see level.
These colors map to specific heights. This is shown in the gradient between colors. like this between beige & brown.
This is color mapping!
Why do we need this?!
We need color mapping because if this data was given in its numerical form, it would be really difficult for ppl to interpret. This visual form makes things easier & more fun.
How do we make this color mapping?
we have 2 main methods to this
- using a look-up table
- using a transfer function
what are these methods, and which one will we be using?
It depends on the problem we have.
If we have specific discrete values, we can use the look-up table. It will probably do the job required and it is easier to implement.
If we have continuous values (like the gradient mentioned above), we'll need to use the transfer function. Because when we use the transfer function we not only map 2 colors (for example) but we map all the gradients that lies between them, which represents more data.
Now let's talk about the 2 methods we have
Look-up table (LUT)
as mentioned b4, it is suitable when we have specific discrete data.

as you can see here, there are only 6 colors that represent some ranges of data
- less than 18 --> baby blue
- 18 - 20 --> light blue
- 20 - 22 --> off white
- 22 - 24 --> orange
- more than 24 --> red
- if the depth is less than 1000m then it's mapped to white
this can be reflected in a table that contains these colors (array).
when given a value "S", this value is mapped to a color "C".
Index(c)=([(S-Smin)/(Smax-Smin)]*numberOfColors)
if S was the min value, then Index(c) will be equal to 0*numberOfColors = 0 (1st color)
if S was the max value, then Index(c) will be 1*numberOfColors = numberOfColors (last color)
and of course if it was in between them it will give us an index in the array of colors we have.
This is briefly how the LUT works.
Now what about the transfer function?
What's special about it?
Transfer Function
The special part about the transfer function is mapping every gradient between any 2 colors.

as you can see in this picture, every color is a start in a range of values, till another range begins.
How will we get a value to a specific degree of the color?
Using Interpolation.
Let's start with an easy example.
if the first color is red (C1) & the 2nd color is yellow (C2)
C1 represents a value of 100 and C2 represents 200
and we want to know the value of the color corresponding 150
what will we do?
This is a simple case, as we know that the required color (C3) lies exactly in the middle of C1 & C2
so we deduce that C3=0.5*C1 + 0.5*C2
what if it didn't lie exactly @ the middle of 2 colors?
We'll calculate where exactly does it lies. This will be i (index of previous color) + f (fraction). (i+f) will be smaller than (i+1), as it lies between i & (i+1).
i = floor ((S-Smin)/∆S)
f= (S-Smin)/∆S – i
then, C = (1-f)*Ci + f*C(i+1)
i: is the index of a color
f: is the fraction in a given index
This will give us the exact color of any value in our continuous data. Hence, we'll be able to formulate a visualization like the one shown above :)
I hope you find this post interesting & useful :)
Al Salam 3alikom w ra7mat Allah w barakatoh

noraaaaaaaaaaaa i like it sooo much bgd ,,,keep up sweeety :D
ReplyDeletethaanks simozz
ReplyDeleteta3aly ma3ana SC ba2a :D
wana aseblek all my visualization tasks :D :D