Al Salam 3alikom w ra7mat Allah w barakatoh :)
yesterday we had our visualization practical exam. I really enjoyed the package we did in that subject. I learned a lot & had fun debugging the colors :D
Here it is...

Visualizing scalar data using the following techniques
-Edge coding
-Face coding
-Line contouring
-Flooded contouring
-Iso surface [marching cubes]
How to Use it?
Getting Started
Open a file [included with the setup file]
File->Open->browse for a file
Apply any of the algorithms
File->Apply->select an algorithm
Select a variable to visualize (if there exist multi variables in the file)
Properties->Visualized Data->select from the combo-box (if there exist other variables for the file)
Mesh visibility
you can choose whether the original mesh is visible or not
Properties->Mesh visibility->Show/Hide
Choose a coloring style
Properties->Color map style->LUT/TF
Mouse Interaction
There is also some friendly interaction with the mesh using the mouse
Zooming
press 'z' to enable/disable zooming
zoom in: double click
zoom out: right click
Translation
press 't' to enable/disable translation
now drag & drop the mesh (it doesn't move while dragging)
Rotation
press 'r' to enable/disable rotation
just like in translation u'll act as if you are dragging the mesh in order to rotate it...also doesn't rotate except when you release the mouse hold.
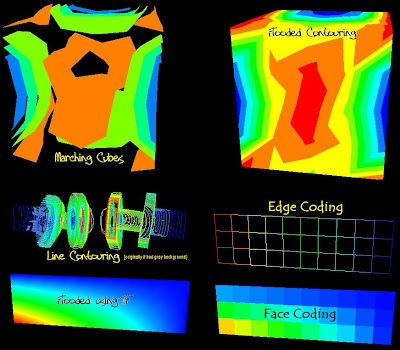
Here is a sample output

This project is built using C# & OpenGL
Find the project & some sample data files in my shared files =)

Marching Cubes works on some special meshes (3D)
use order1.dat
Despite all the negative energy I had this term :D
This project, this subject & this doctor...really made SC Rocks :D
Related Links:
color map editor: The basic idea of the whole thing
Contouring: I remember when I wrote this post, wasn't actually understanding what I was trying to do :D


